
15 Procurement KPIs Every Organization Should Track in 2026 (Plus a Digital Procurement Measurement Guide)
As we approach the final stretch of 2026, organizations are navigating an increasingly challenging business landscape, with volatile raw material costs and more complex supply chains than ever before, procurement is no longer just about “buying at the lowest price.” It has become a strategic function that must prove its value through measurable, data-backed results.
Many organizations still track performance manually, lack a centralized dashboard, and struggle to identify which procurement KPIs truly reflect operational effectiveness. Some teams even focus on the wrong metrics — chasing the lowest price while overlooking supplier risk or compliance gaps entirely.
This 2026-updated guide compiles 15 KPIs used by leading procurement professionals worldwide, complete with simple formulas, rough industry benchmarks, and an explanation of how digital procurement platforms like eRFX and Dashboard make measuring them faster and more accurate. Whether you’re just starting to formalize your procurement metrics or you’re a procurement leader looking to level up executive reporting, this article has you covered.
Why It Matters
Without clear KPIs, organizations face several business risks:
- Poor budget visibility — Leadership makes decisions without real-time data, missing cost-saving opportunities.
- Unstructured supplier evaluation — Increases the risk of working with underperforming suppliers.
- Slow compliance and audit readiness — Without traceable data, governance teams spend excessive time on manual checks.
- Reduced competitiveness — Organizations that measure procurement accurately often achieve 5-10% lower costs than competitors.
- No proof point for leadership — Without hard numbers, procurement risks being seen as a cost center instead of a strategic partner.
Having the right KPIs is the starting point for transforming procurement from a back-office function into a true strategic partner.
Key Concepts to Know First
Before diving into the list, let’s clarify key terminology.
Cost Savings vs Cost Avoidance
- Cost Savings refers to tangible cost reductions compared to last year’s price or budget.
- Cost Avoidance refers to preventing future cost increases, such as locking in prices before a supplier raises them.
Cycle Time
The time from requisition initiation to purchase order (PO) issuance, or through to goods receipt. Shorter cycle times reflect stronger process efficiency.
Spend Under Management
The proportion of total procurement spend that flows through a controlled, trackable procurement process (as opposed to maverick spend).
Maverick Spend
Purchases made outside the organization’s approved procurement process — for example, buying directly from a supplier without a PO or proper approval. A high maverick spend ratio signals weak spend control.
15 Procurement KPIs to Track in 2026
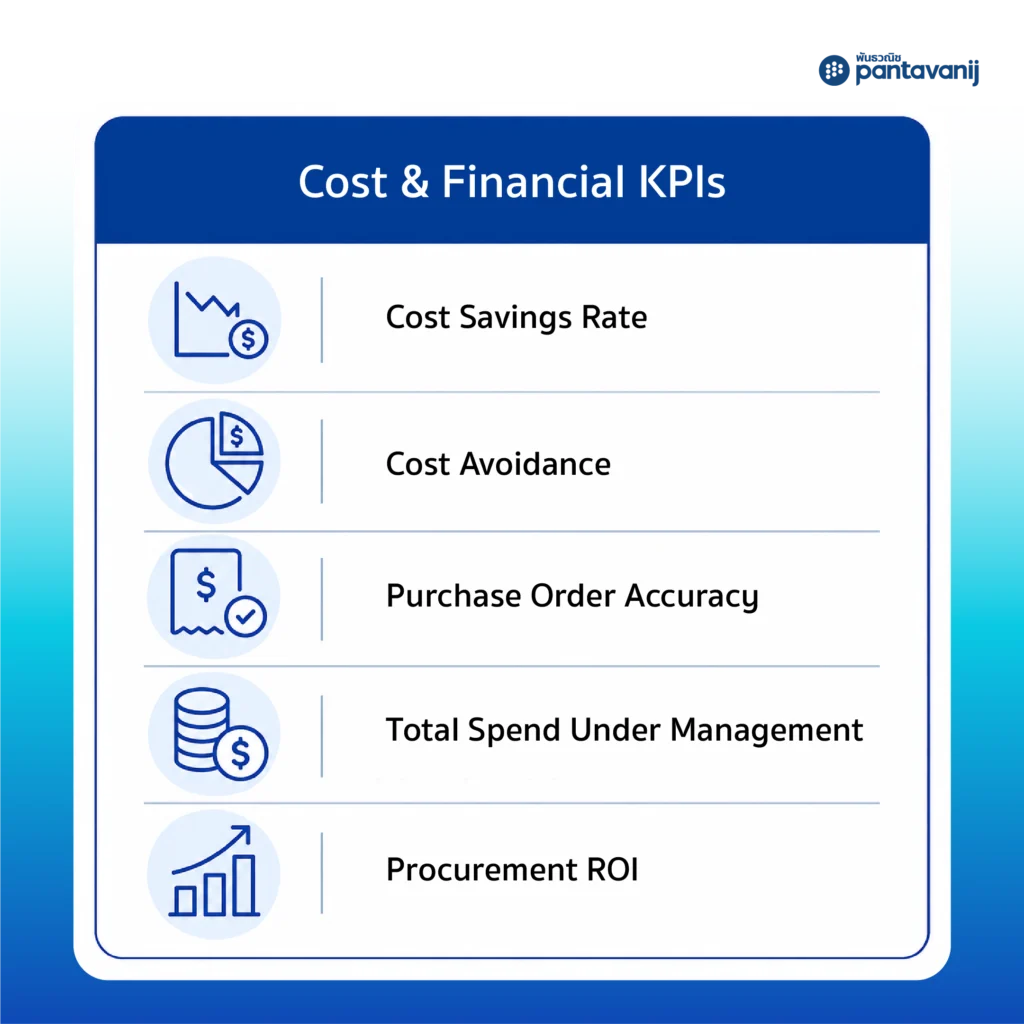
Cost & Financial KPIs
|
KPI |
Definition |
Formula (approximate) |
| Cost Savings Rate (%) | Cost reduction relative to original budget | (Original budget − actual cost) ÷ original budget × 100 |
| Cost Avoidance ($) | Value of costs successfully avoided | Expected price − negotiated price |
| Purchase Order Accuracy (%) | Accuracy of POs versus original requisitions | Accurate POs ÷ total POs × 100 |
| Total Spend Under Management (%) | Share of budget under controlled procurement processes | Managed spend ÷ total spend × 100 |
| Procurement ROI | Return on investment from procurement operations | (Value saved − procurement operating cost) ÷ procurement operating cost |
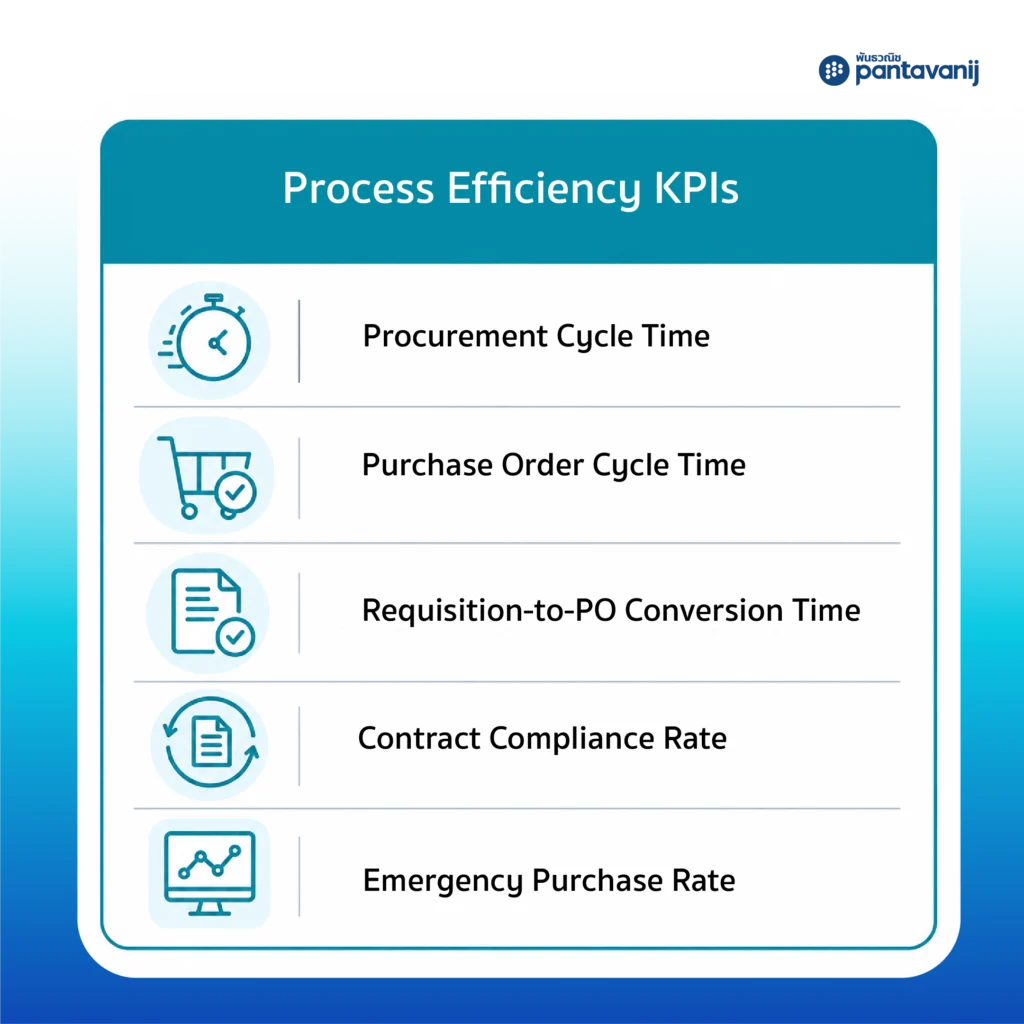
Process Efficiency KPIs
| KPI |
Definition |
| Procurement Cycle Time | Average time from requisition to PO |
| Purchase Order Cycle Time | Time from PO issuance to goods receipt |
| Requisition-to-PO Conversion Time | Speed of converting requests into POs |
| Emergency Purchase Rate (%) | Share of rushed purchases, indicating planning gaps |
| Contract Compliance Rate (%) | Share of purchases aligned with agreed contracts |
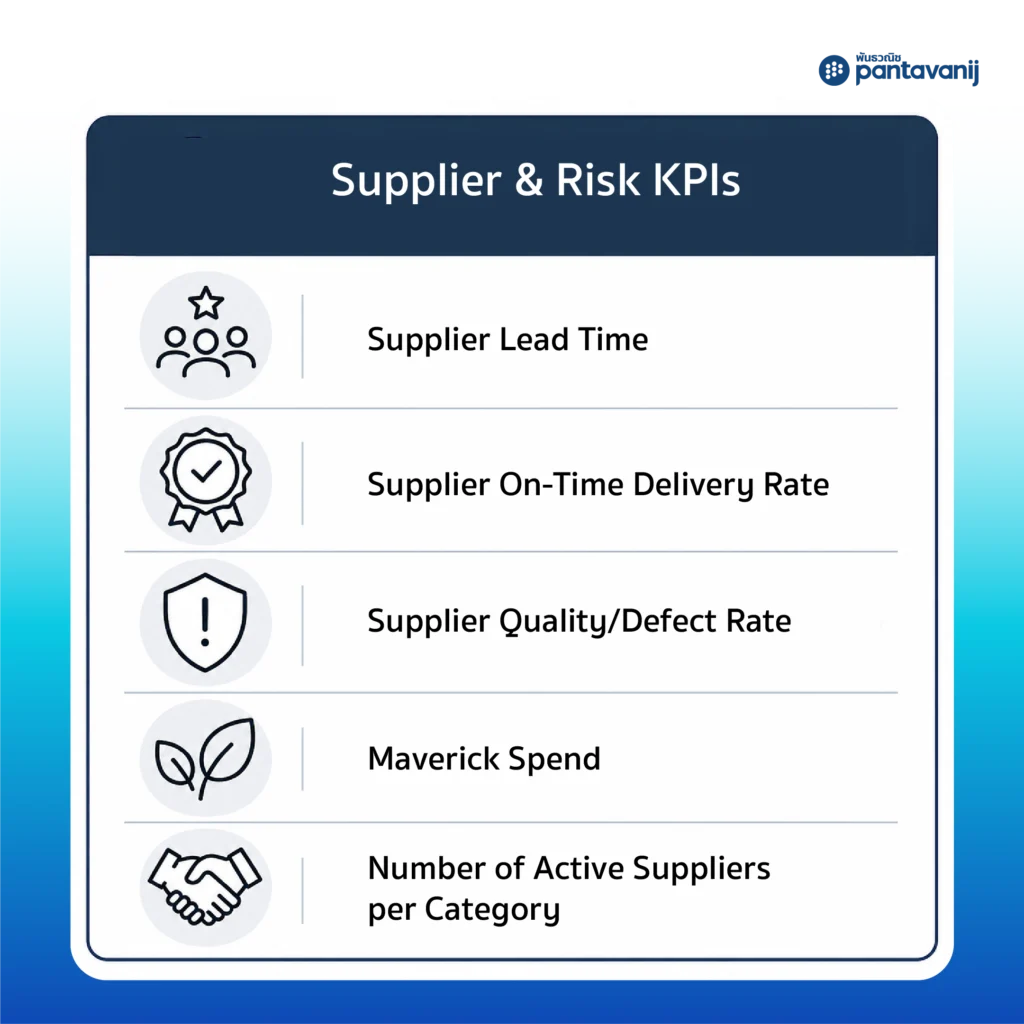
Supplier & Risk KPIs
|
KPI |
Definition |
| Supplier On-Time Delivery Rate (%) | Rate of on-time deliveries |
| Supplier Quality/Defect Rate (%) | Rate of non-conforming goods |
| Supplier Lead Time | Average time suppliers take to deliver |
| Number of Active Suppliers per Category | The number of active suppliers in each product category to assess sourcing risk and supply base diversification. |
| Maverick Spend (%) | Share of purchases made outside approved processes |
💡 Tip: You don’t need to track all 15 KPIs from day one. Start with the 5-6 metrics that address your organization’s most urgent problem, then expand as your data infrastructure matures.
Rough Benchmarks for Reference
Best-in-class organizations typically hover around these figures (use as directional guidance, not a fixed standard, since benchmarks vary by industry):
- Cost Savings Rate: 5-10% annually
- Supplier On-Time Delivery: above 95%
- Contract Compliance Rate: above 90%
- Maverick Spend: below 5%
Best Practices
Leading organizations that manage procurement effectively tend to:
- Establish a baseline before measuring — Collect at least 12 months of historical data to build a comparison benchmark.
- Match KPIs to organizational maturity — Early-stage teams should prioritize compliance and cycle time before advanced cost avoidance metrics.
- Review KPIs on a regular cadence — Monthly for operational KPIs, quarterly for strategic KPIs.
- Link KPIs to business objectives — For example, connecting cost savings to the company’s gross margin targets.
- Use a centralized dashboard — Accessible to both procurement and finance teams to reduce data discrepancies.
- Don’t forget the requester side — Better communication with internal requesters reduces emergency purchases and maverick spend at the source.
Common Mistakes When Starting to Track Procurement KPIs
- Tracking too many KPIs at once, leaving the team unsure what to prioritize
- No baseline, making performance comparisons meaningless
- Data scattered across multiple systems (spreadsheets, email, ERP), causing numbers to conflict
- Setting targets disconnected from actual business objectives
How Digital Procurement Solves This
Manually tracking KPIs through spreadsheets has real limitations: data isn’t real-time, manual entry increases error risk, and root-cause analysis is difficult.
Digital procurement platforms solve this by:
- Consolidating data from every step of the procurement cycle (RFQ, PO, GR, Invoice) into one system
- Calculating KPIs automatically in real-time dashboards
- Providing visibility by category, supplier, and business unit
- Sending automated alerts when KPIs deviate from targets
How Pantavanij Supports This Journey
Pantavanij helps organizations track procurement KPIs with greater speed and accuracy through two core solutions:
- eRFX — A digital procurement system that captures every step from quotation requests to approval, automatically generating accurate data on cycle time, compliance rate, and cost savings — no manual entry required.
- Dashboard — Displays real-time KPIs in an executive-friendly format, helping procurement teams present results with confidence and act on insights immediately.
Learn more about the eRFX Solution
If your organization is looking to move from manual tracking to real-time, accurate procurement data, the Pantavanij team is ready to offer a free consultation.
Frequently Asked Questions (FAQ Section)
Q1 : What is the most important procurement KPI?
A : There’s no single answer — it depends on organizational goals. However, Cost Savings Rate, Cycle Time, and Supplier On-Time Delivery are typically the first three metrics most organizations track.
Q2 : Which procurement KPI should a beginner organization track first?
A : Start with Cycle Time and Compliance Rate, as they are easier to measure and show results quickly, before moving to more complex metrics like Cost Avoidance.
Q3 : How much time can digital procurement save on KPI reporting?
A : Organizations using automated dashboards can reduce KPI reporting time from several days to just minutes, since data updates in real time.
Q4 : How often should procurement KPIs be reviewed?
A : Operational KPIs should be reviewed monthly, while strategic KPIs like Cost Avoidance should be reviewed quarterly.
Q5 : If my organization still uses spreadsheets, do I need to switch to digital procurement immediately?
A : Not necessarily. Start by consolidating your key data into one place, then gradually move toward full automation as your organization becomes ready.
Q6 : Do these KPIs apply to every industry?
A : The general principles apply across industries, but benchmark values and the relative importance of each KPI can vary by business type — manufacturing, for example, may weight supplier quality more heavily than a services business.
Systematically tracking procurement KPIs is the foundation for elevating procurement from a support function into a strategic value driver. Choosing the right KPIs, establishing an accurate baseline, and leveraging digital procurement technology to capture and analyze data enables procurement teams to work faster, more accurately, and make better decisions at every level.
If you’d like help identifying which KPI to track first, or want to see a live dashboard example, the Pantavanij team is happy to offer a free consultation.